
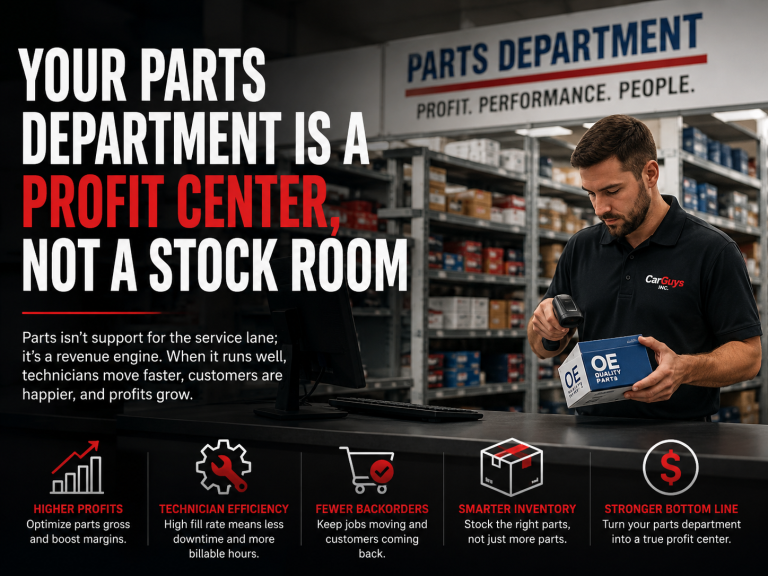
Walk through most dealerships, and you’ll find the parts department tucked in the back, staffed lean, and treated like a cost of doing business. That framing is costing you money. At CarGuys Inc., we work with service operations across the country, and one of the most consistent blind spots we see is a parts department that leadership undervalues until something breaks. Parts isn’t support for the service lane; it is a revenue engine in its own right. When it runs well, technicians move faster, customer satisfaction climbs, and gross profit compounds. When it doesn’t, the losses are quiet but significant.
This post is about repositioning how you think about parts and giving you the benchmarks and business case to act on it.
Parts Gross vs. Service Gross: Understanding the Real Contribution
Most service managers track labor gross closely. Parts gross gets less attention, which is a mistake, because in most dealerships parts contribute between 40% and 50% of total fixed ops gross profit. That’s not a rounding error. That’s nearly half your fixed ops revenue hiding in a department that doesn’t always get its own P&L review.
Parts gross is driven by retail margin on customer-pay work, warranty reimbursement rates, and internal pricing on technician jobs. Each of those levers is adjustable. Dealers who actively manage their parts matrix, push for fair warranty parts reimbursement, and price internal jobs correctly are capturing margin that others are leaving on the table.
The relationship between parts and service gross is also symbiotic. A parts department that can’t support the service lane’s throughput – because it runs out of stock, loses orders, or can’t pull parts fast enough – directly suppresses labor hours billed. You can have a fully staffed service drive and still underperform because parts is the bottleneck.
Fill Rate and Its Direct Impact on Technician Efficiency
Fill rate – the percentage of parts requests fulfilled from on-hand inventory – is one of the most consequential metrics in your entire service operation, yet most managers couldn’t tell you their number without digging through a report.
Here’s what happens at the bay level when the fill rate is low: a technician pulls a job ticket, gets the vehicle on the lift, and then waits. They wait for a part to be located, ordered, delivered, or sourced from a local supplier. That wait time is unbillable. Flat-rate technicians especially feel this acutely; they don’t get paid for the time they spend standing still. Low fill rate kills their effective labor rate and their paycheck, which is a retention problem as much as a productivity problem.
Industry benchmarks for on-hand fill rate range from 85% to 92% in dealer parts operations. Shops operating below 80% consistently lose technician hours every day. The fix isn’t always buying more inventory; it’s buying smarter inventory. Parts managers who analyze their demand history by technician, by job code, and by vehicle make can build a stocking strategy that dramatically improves fill rate without inflating carrying costs.
Poor fill rates don’t just reduce productivity – they also accelerate technician turnover. Few things frustrate flat-rate technicians more than waiting on parts instead of turning hours. Over time, repeated delays reduce earnings, increase frustration, and make competing dealerships with better operational support far more attractive. As technician shortages continue across the industry, dealerships can’t afford to lose productive employees because of preventable operational issues. Just as importantly, they must continuously improve technician recruiting to replace unavoidable turnover and maintain service capacity.
Why Parts Inventory Management Affects Technician Efficiency
The Revenue You’re Losing to Backorders Right Now
Backorders create a chain reaction that most dealerships never fully account for. When a part isn’t available, the best case is a delayed repair and a customer who has to come back. The worst case is a customer who goes somewhere else – and doesn’t come back at all.
For internal shop work, backorders translate directly to stalled repair orders. A vehicle sitting in a bay or on a lot while waiting for a part occupies space, delays the next job, and generates zero labor revenue. In a shop running 10 to 15 technicians, even two or three stalled ROs per day can represent thousands of dollars in weekly throughput loss.
Effective parts operations reduce backorder exposure through a few specific practices: maintaining emergency stock on high-frequency failure parts, building relationships with multiple wholesale suppliers for fast local sourcing, and creating a formal escalation process for stalled ROs so service advisors and managers know exactly when a part is expected and can communicate accurately with the customer. Backorders will always exist, but how your team handles them determines whether customers come back.
The Hidden Cost of Obsolete Parts Inventory
Obsolete inventory is one of the most deceptive problems in a dealership. It sits on the shelf, it shows up on the balance sheet as an asset, and it quietly erodes your financial position. Parts that haven’t moved in 12 months or longer are not assets; they’re capital that’s been converted into something you probably can’t sell at cost.
The obsolescence problem compounds over time. Parts from discontinued models, superseded part numbers, and products tied to service campaigns that wrapped up two years ago accumulate due to a lack of a dedicated process to identify and remove them. Dealers who aren’t running regular obsolescence reviews are typically sitting on 10% to 20% of their total parts investment in stock that will never move at retail.
The financial exposure is real. Obsolete inventory ties up working capital, increases carrying costs, and eventually requires a write-down that hits your books as a loss. The solution is a standing monthly review of aged inventory with defined action thresholds: return to the manufacturer when return programs exist, wholesale to used-parts networks at a discount, or write off what can’t be recovered. Painful in the short term; necessary for long-term financial health.
Obsolete Inventory Is Killing Your Cash Flow
KPI Benchmarks Every Parts Manager Should Own
If your parts department isn’t being measured, it isn’t being managed. These are the benchmarks that separate a reactive stock room from a proactive parts department profit center:
- Days Supply: This measures how many days of inventory you’re carrying based on current demand. The target range for most franchised dealers is 20 to 30 days. Below 20, you’re at risk of fill-rate failures; above 45, you’re overinvested and increasing the risk of building obsolescence.
- Inventory Turns: A healthy parts operation turns its inventory 12 to 15 times per year. Slower turns signal either overstocking, demand changes, or a growing obsolescence problem. Faster turns without a fill rate penalty indicate excellent demand forecasting.
- Gross Margin: Parts gross margin benchmarks vary by sale type. Retail customer-pay work should target 38% to 45% gross margin. Warranty parts typically yield lower margins, depending on manufacturer reimbursement rates, which you should review and optimize annually or whenever your state law allows. Internal (technician) work often runs 20% to 25% gross margin.
- Fill Rate: As covered earlier, target 85%-92% on-hand fill rate. Track this separately for customer-pay, warranty, and internal work, because the sourcing strategy differs across all three.
- Obsolescence Percentage: If aged parts (12 months or older with no movement) exceed 8% to 10% of your total parts investment, it’s time for an active cleanup plan.
These aren’t aspirational figures. They’re operational baselines used by well-run dealers across the country. If your parts manager can’t quote these numbers in a weekly ops meeting, that’s the first place to start.
Repositioning Parts Starts with Leadership
The dealers who treat parts as a profit center share one thing in common: the parts manager has a seat at the table in fixed ops discussions, not just an inbox for purchase orders. When service managers and parts managers align around shared KPIs – fill rate, throughput, days supply – the entire service operation benefits.
That alignment starts with staffing the parts department with people who understand inventory management as a business discipline, not just a logistics function. A strong parts manager reads their demand data, manages supplier relationships strategically, monitors obsolescence, and advocates for appropriate pricing. They operate less like a warehouse clerk and more like a procurement analyst with a direct line to your service gross.
If your parts department is understaffed, led by someone without the tools or authority to optimize operations, or simply flying under the radar of your monthly performance review, the margin impact is real and ongoing. The question isn’t whether parts can be a profit center. It already is one – the question is how much of that profit you’re actually capturing.
CarGuys Inc. is an automotive technician recruiting company built exclusively for the car business. From technicians and service advisors to salespeople and managers, we connect dealerships and repair shops with qualified talent faster, using nationwide reach and years of hands-on experience.
If you want to quantify technician turnover, staffing shortages, empty bay loss, labor rate strategy, and service department profitability, visit our Service Department Calculators Hub.


With over 700 clients and thousands of hires, we don’t just fill positions; we help build stronger teams that foster long-term success.