When a technician leaves, the damage usually goes far beyond payroll. Most dealerships and repair shops feel the loss immediately through missed labor sales, reduced shop capacity, scheduling delays, and added pressure on the remaining team. Yet many operators still underestimate the true cost of technician turnover.
How Much Does Technician Turnover Cost?
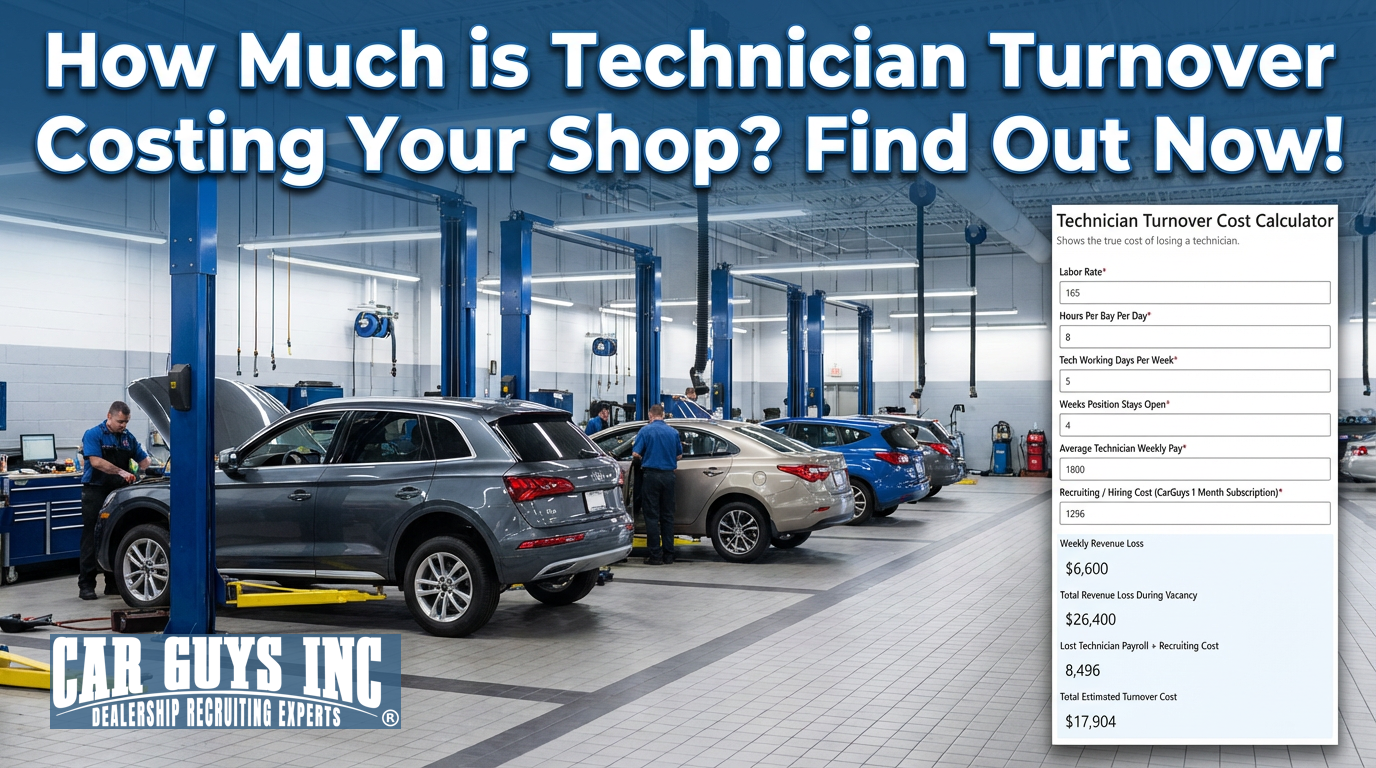
This Technician Turnover Cost Calculator helps show the financial impact of an open technician position by estimating weekly revenue loss, total lost revenue during the vacancy, and the additional cost of replacing that employee. For service managers, fixed ops directors, dealer principals, and shop owners, it can be a powerful tool for understanding why retention and fast hiring matter so much.
Instead of looking at technician turnover as a simple staffing inconvenience, this calculator reframes it as a revenue event. That shift can lead to better decisions around pay, recruiting urgency, staffing strategy, and retention efforts.


An open technician position affects much more than one empty bay. It can reduce appointment availability, slow turnaround times, increase advisor frustration, and place extra strain on the rest of the shop. In many cases, the financial impact builds quietly week after week until leadership realizes the department has lost far more than expected.
This calculator gives you a practical way to estimate that damage. Once you can see the revenue loss and replacement cost tied to technician turnover, it becomes easier to justify faster recruiting action, stronger retention plans, and better workforce planning.
For many shops, the real takeaway is simple. Losing a technician is expensive. Leaving the role open too long is even more expensive.
Industry Technician Turnover Benchmarks
A strong calculator page should not just provide the tool, it should also help users understand what numbers make sense. Below are common benchmark ranges for each input.
Technicians Labor Rate
Labor rate is one of the biggest drivers of turnover cost because an empty technician position often means unsold labor hours.
Typical ranges:
- Independent repair shops: $110 to $170
- Mainline dealership service departments: $140 to $210
- Luxury, diesel, or high-cost metro markets: $190 to $275+
For best results, use your effective labor rate if you want a more realistic estimate of actual revenue lost.
Hours Per Bay Per Day
This field estimates how many billed labor hours one productive technician bay can typically produce each day.
Typical ranges:
- Lower-volume or underperforming shops: 5 to 7 hours
- Average shops: 7 to 9 hours
- High-performing service departments: 9 to 12+ hours
The right number depends on dispatching, advisor effectiveness, technician skill, and how consistently work is flowing through the shop.
Tech Working Days Per Week
This reflects the number of days the technician would typically be scheduled each week.
Typical ranges:
- Standard schedule: 5 days
- Extended or rotating schedule: 5.5 to 6 days
- Special operations or weekend-heavy stores: 6+ days
For most stores, 5 days per week is a practical default.
Weeks Position Stays Open
This is one of the most important inputs because the longer the position stays open, the more the financial loss compounds.
Typical ranges:
- Entry or mid-level technician roles: 4 to 8 weeks
- Experienced technician roles: 6 to 12 weeks
- Master tech, brand specialist, or hard-to-fill positions: 10 to 20+ weeks
In difficult markets, some technician vacancies can remain open for months.
Average Technician Weekly Pay
This input helps estimate the payroll component associated with turnover and replacement economics.
Typical ranges:
- Lower-paid technician roles: $900 to $1,200 per week
- Experienced line technicians: $1,200 to $1,800 per week
- High-level diagnostic or master technicians: $1,800 to $2,500+ per week
Use the weekly amount that best reflects the position being replaced.
Recruiting / Hiring Cost
This includes job advertising, recruiter cost, internal time, sign-on incentives, onboarding, relocation, referral bonuses, and related hiring expenses.
Typical ranges:
- Basic in-house hiring effort: $500 to $2,000
- Moderate recruiting investment: $2,000 to $5,000
- High-urgency or specialized technician recruiting: $5,000 to $12,000+
This figure can vary widely depending on whether the business relies on internal recruiting, third-party help, or paid sourcing campaigns. Traditional recruiting firms may also add substantial headhunter fees on top of those costs, which can drive the total even higher for hard-to-fill technician roles.
CarGuys was built to solve that problem differently. Our subscription-based recruiting model helps dealerships and repair shops hire without paying headhunter fees on each placement. For employers that need ongoing technician recruiting support, that structure can create more predictable costs and better long-term value.

Why Technician Turnover Is So Expensive
Most leaders understand that turnover is frustrating. Fewer fully understand how quickly it turns into a financial problem.
When a technician quits, the store often loses:
- Billed labor opportunity
- Related parts sales
- Shop throughput
- Appointment flexibility
- Customer satisfaction
- Team stability
At the same time, the business may also face new recruiting expenses, training time, overtime pressure, and reduced morale among remaining staff.
That means the cost of turnover is not just about replacing one person. It is about the revenue gap that opens while the position remains vacant and the cost of closing that gap.
How This Technician Turnover Calculator Works
This calculator focuses on the vacancy impact of losing one technician.
Weekly Revenue Loss
= Labor Rate x Hours Per Bay Per Day x Tech Working Days Per Week
Total Revenue Loss During Vacancy
= Weekly Revenue Loss x Weeks Position Stays Open
Lost Technician Payroll + Recruiting Cost
= (Average Technician Weekly Pay x Weeks Position Stays Open) + Recruiting / Hiring Cost
Total Estimated Turnover Cost
= Total Revenue Loss During Vacancy + Lost Technician Payroll + Recruiting Cost
This model helps show both the production loss and the employment cost impact tied to a technician vacancy.
Example Technician Turnover Cost Calculation
Let’s say the numbers look like this:
- Labor Rate: $160
- Hours Per Bay Per Day: 8
- Tech Working Days Per Week: 5
- Weeks Position Stays Open: 8
- Average Technician Weekly Pay: $1,500
- Recruiting / Hiring Cost: $3,000
Weekly Revenue Loss
160 x 8 x 5 = $6,400
Total Revenue Loss During Vacancy
$6,400 x 8 = $51,200
Lost Technician Payroll + Recruiting Cost
($1,500 x 8) + $3,000 = $15,000
Total Estimated Turnover Cost
$51,200 + $15,000 = $66,200
That is the kind of number that changes the conversation. A technician departure is not just a staffing issue, it is a measurable financial event.
Revenue Loss Is Usually the Biggest Hidden Cost
Many managers focus first on the visible recruiting cost. That is understandable because invoices, ad spend, and bonuses are easy to see. But the larger cost is often the lost labor revenue during the vacancy.
An empty bay means fewer labor hours billed. Fewer labor hours often mean fewer parts sold. It can also mean:
- Longer wait times for customers
- Delayed repairs
- Lower advisor closing confidence
- More pressure on existing technicians
- Greater risk of burnout and further turnover
This is why even a short vacancy can become costly. In a productive service department, every open week matters.
Technician Turnover Also Hurts Long-Term Performance
The financial loss from turnover does not always stop when the position is filled. New hires may take time to ramp up, adapt to the workflow, and reach full production. Existing team members may still be recovering from the added workload created during the vacancy.
Turnover can also create a chain reaction. When one technician leaves and the rest of the team absorbs more stress, morale may drop. That can lead to lower productivity, more mistakes, and even more departures.
In other words, technician turnover is often both a direct cost problem and a culture problem.
How Shops Can Reduce Technician Turnover Cost
Reducing turnover cost usually comes down to two priorities: keep strong technicians longer, and fill open positions faster.
Strategies that often help include:
- More competitive pay plans
- Better shop workflow and dispatching
- Clear advancement opportunities
- Stronger service leadership
- Better recruiting systems
- Faster follow-up with candidates
- Consistent retention conversations
- Cleaner onboarding processes
Many stores wait until turnover becomes painful before they act. By then, the damage is already underway. This calculator helps create visibility before that happens again.
Why This Calculator Matters for Fixed Ops Leadership
For fixed ops leaders, technician turnover affects nearly every important metric:
- Labor sales
- Gross profit
- Effective labor utilization
- Customer retention
- Appointment lead time
- Technician morale
When you can estimate the cost clearly, you are in a much better position to justify investments in recruiting, retention, and process improvement. It is much easier to defend a stronger pay plan, better sourcing tools, or a faster hiring system when the cost of inaction is visible.
Technician Turnover Cost Calculator FAQ
What is included in technician turnover cost?
This calculator includes estimated lost labor revenue during the vacancy plus technician payroll value and recruiting or hiring cost. It does not fully include secondary effects such as lost parts margin, reduced CSI, overtime, training ramp-up, or burnout impact.
How long does a technician position usually stay open?
That depends on market conditions, shop reputation, pay competitiveness, and recruiting speed. Many technician vacancies stay open anywhere from 4 to 12 weeks, with hard-to-fill roles lasting much longer.
Should I use posted labor rate or effective labor rate?
Effective labor rate usually produces a more realistic estimate because it reflects what your department actually collects per billed hour.
Why is technician weekly pay included?
It helps show the employment cost tied to the vacancy period and the overall economics of replacing the role. It also gives more perspective when evaluating whether retention investments are worth the cost.
Does this calculator include parts revenue loss?
Not directly. This version focuses primarily on labor revenue loss. In many real-world cases, the total financial impact is actually higher because parts sales often decline when labor production drops.
How can I reduce technician turnover?
Strong pay, better leadership, cleaner workflow, real career paths, and faster recruiting systems all help. Many turnover problems are tied to preventable shop frustration, not just compensation.
Wrapping It Up
The Technician Turnover Cost Calculator helps show the true financial impact of losing a technician and leaving the position open. What may seem like a routine staffing issue can quickly turn into a serious revenue loss once you account for missed labor sales, replacement cost, and the length of the vacancy.
For service departments trying to improve profitability, technician retention is not just an HR concern. It is a fixed ops performance issue. Every open bay represents lost opportunity, and every extra week without a qualified technician adds more pressure to the department.
Use this calculator to put a real number on technician turnover. Once the cost becomes visible, it is much easier to make smarter decisions around retention, compensation, and recruiting speed.
CarGuys Inc. is an automotive recruiting agency built exclusively for the car business. From technicians and service advisors to salespeople and managers, we connect dealerships and repair shops with qualified talent faster, using nationwide reach, and years of hands-on experience.

With over 700 clients and thousands of hires, we don’t just fill positions;
we help build stronger teams that drive long-term success.