Every technician on your team represents far more than an hourly payroll expense. A productive technician can generate substantial labor sales, drive additional parts revenue, and contribute meaningful gross profit to the service department over the course of a year.
What the Technician Revenue Calculator Does
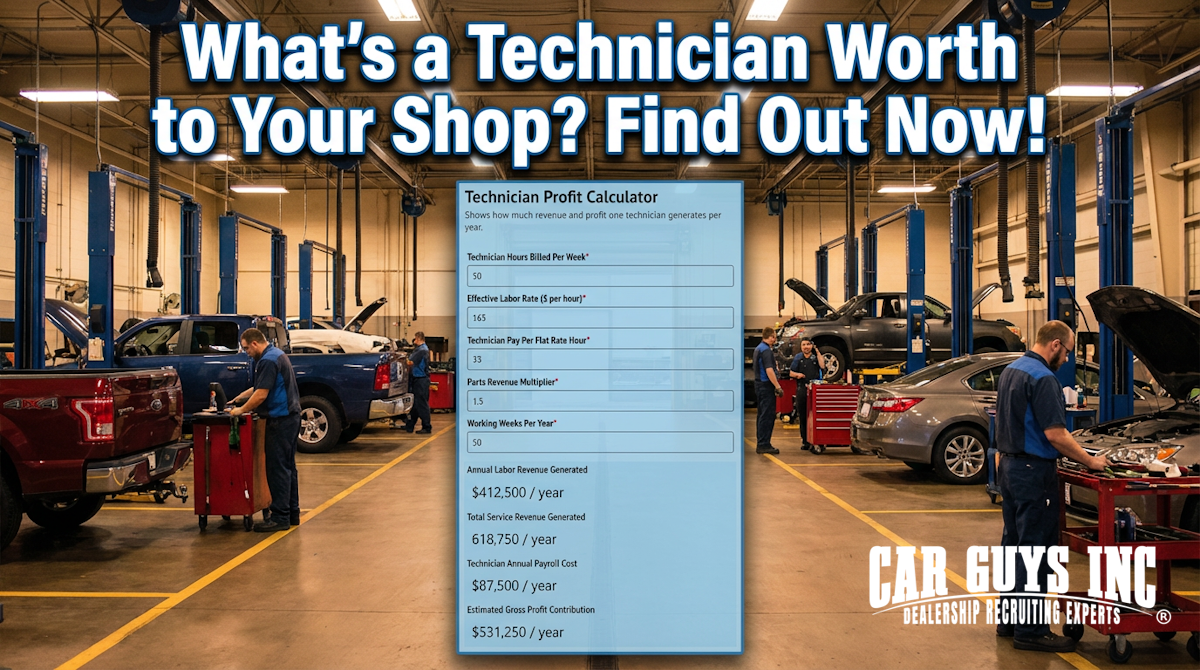
This Technician Revenue Calculator helps estimate how much annual revenue one technician produces based on billed hours, labor rate, technician pay, and related parts sales. It is a useful tool for dealer principals, fixed ops directors, service managers, and shop owners who want a clearer picture of technician value.
Instead of viewing technician compensation as just a cost, this calculator helps shift the conversation toward production, contribution, and profitability. That perspective is especially important when evaluating hiring decisions, pay plans, retention strategies, and shop expansion opportunities.


A strong technician does not just fix vehicles. They generate labor sales, support parts revenue, increase shop throughput, and help the service department hit its financial goals. When you measure technician performance through a revenue lens, it becomes easier to understand what a productive hire is actually worth.
This calculator gives you a practical way to estimate the annual top-line and gross profit contribution of one technician. That can be helpful when comparing compensation plans, recruiting costs, productivity expectations, or the long-term value of retaining experienced team members.
It also helps highlight a key truth in fixed operations: the right technician is not just a payroll line item. The right technician is a revenue-producing asset.
Industry Benchmarks for Calculator Input Values
The most useful calculator pages do more than provide formulas. They also help users understand what numbers are realistic. Below are common benchmark ranges for each input field.
Technician Hours Billed Per Week
This is one of the biggest drivers of annual technician value. It reflects how many flat rate or billed hours a technician produces in a normal week.
Typical ranges:
- Low productivity or entry-level: 25 to 35 hours
- Average producer: 35 to 45 hours
- Strong producer: 45 to 55 hours
- High performer or specialized master tech: 55 to 70+ hours
A technician billing 50 hours per week over a full year creates a much different revenue profile than one billing 32 hours per week.
Effective Labor Rate ($ per hour)
Your effective labor rate is the average amount collected per billed labor hour. Some shops use customer-pay rate, while others prefer a blended rate across customer-pay, warranty, and internal work.
Typical ranges:
- Independent shops: $110 to $170
- Mainline franchise dealerships: $140 to $210
- Luxury or high-cost metro markets: $190 to $275+
Using an effective rate rather than a posted door rate usually produces a more realistic estimate.
Technician Pay Per Flat Rate Hour
This is the amount the technician earns for each billed flat rate hour. Pay can vary widely based on market, brand, skill level, and store compensation strategy.
Typical ranges:
- Entry-level or lower-paid markets: $20 to $28
- Experienced technician: $28 to $40
- High-level diagnostic or master technician: $40 to $55+
A technician may appear expensive on paper, but once you compare pay to total revenue generation, the economics often look very different.
Parts Revenue Multiplier
This input helps estimate how much related parts revenue is generated from labor production. Since service work often drives both labor and parts sales, this multiplier gives a more complete view of technician contribution.
Typical ranges:
- Light maintenance-heavy shop: 1.3 to 1.6
- Balanced repair mix: 1.6 to 2.0
- Heavy repair or larger ticket shop: 2.0 to 2.4+
For example, a 1.5 multiplier means every $1.00 of labor revenue is associated with $0.50 in parts revenue.
Working Weeks Per Year
This represents the number of weeks a technician is expected to work annually after accounting for vacations, holidays, training, and time off.
Typical ranges:
- Conservative estimate: 48 weeks
- Common planning estimate: 50 weeks
- Full schedule with limited time off: 52 weeks
For forecasting purposes, 50 weeks is often a practical starting point.
Why Technician Revenue Matters in Fixed Ops
Dealerships and repair shops often talk about technician shortages, compensation pressure, and technician turnover. Those are real issues, but they can cause leaders to focus too heavily on cost while underestimating value.
A productive technician does not just cost money. They create revenue, absorb overhead, support parts sales, and improve shop capacity. When one technician is missing, underperforming, or leaves the business, the impact is much larger than their paycheck alone.
That is why measuring annual technician revenue matters. It helps service leaders evaluate hiring and retention decisions based on contribution, not just payroll.
How the Technician Revenue Calculator Works
This calculator is built around a straightforward revenue model.
Annual Labor Revenue Generated
= Technician Hours Billed Per Week x Effective Labor Rate x Working Weeks Per Year
Total Service Revenue Generated
= Annual Labor Revenue Generated + (Annual Labor Revenue Generated x Parts Revenue Multiplier)
Technician Annual Payroll Cost
= Technician Hours Billed Per Week x Technician Pay Per Flat Rate Hour x Working Weeks Per Year
Estimated Gross Profit Contribution
= Total Service Revenue Generated – Technician Annual Payroll Cost
This final number is not a full net profit figure because it does not subtract all operating expenses such as management payroll, benefits, shop overhead, equipment, and occupancy. Still, it offers a strong directional estimate of technician gross contribution.
Example Technician Revenue Calculation
Let’s say one technician produces the following:
- 45 billed hours per week
- $165 effective labor rate
- $32 pay per flat rate hour
- 1.70 parts revenue multiplier
- 50 working weeks per year
Annual Labor Revenue Generated
45 x 165 x 50 = $371,250
Estimated Parts Revenue
$371,250 x 0.70 = $259,875
Total Service Revenue Generated
$371,250 + $259,875 = $631,125
Technician Annual Payroll Cost
45 x 32 x 50 = $72,000
Estimated Gross Profit Contribution
$631,125 – $72,000 = $559,125
This example makes an important point. Even a well-paid technician can represent a major revenue and gross profit driver when productivity is strong.
Why This Calculator Is Useful for Hiring Decisions
When shops struggle to recruit technicians, compensation often becomes the focal point. Leaders may hesitate over signing bonuses, relocation help, better pay plans, or recruiting investment. But those costs should be evaluated against technician contribution.
A productive technician who stays, performs well, and supports throughput can generate hundreds of thousands of dollars in revenue each year. Framed that way, many hiring and retention decisions become easier to justify.
This is especially true when:
- Bays are sitting empty
- Advisors have work that cannot be sold or scheduled
- Customer wait times are growing
- The store is turning away repair opportunities
- Existing technicians are overloaded
In those situations, the cost of not hiring is often greater than the cost of hiring.
Revenue Per Technician and Shop Performance
Revenue per technician is also a useful management metric. It can help you compare:
- One store versus another
- One pay plan versus another
- One technician segment versus another
- Current staffing versus future staffing needs
It also helps answer practical questions such as:
- Is our labor rate aligned with our productivity?
- Are we paying enough to attract revenue-producing talent?
- Are our technicians producing enough billed hours?
- Is our shop getting enough parts revenue from labor sales?
- How much value does one additional technician add?
Once you measure technician contribution clearly, staffing conversations become more strategic and less emotional.
What Can Lower Technician Revenue?
Not every revenue problem is caused by technician skill. In many cases, technicians produce below potential because the shop environment is limiting output.
Common causes include:
- Weak dispatching
- Low advisor close rates
- Poor inspection consistency
- Parts delays
- Excessive downtime
- Training gaps
- Too much warranty or low-value work mix
- Inefficient scheduling
That is why this calculator should be used as both a financial tool and an operational lens. If technician revenue seems low, the right next step may be better recruiting, better process, or both.
Technician Revenue Calculator FAQ
What is a good annual revenue number for one technician?
That depends on labor rate, billed hours, and parts mix. In many dealerships and repair shops, one productive technician can easily generate several hundred thousand dollars in annual labor and related service revenue.
Should I use posted labor rate or effective labor rate?
Effective labor rate usually gives a more realistic estimate because it reflects what the shop actually collects per billed hour.
Does this calculator include benefits and overhead?
No. This version focuses on technician production, payroll cost, and estimated gross contribution. It does not fully subtract benefits, management payroll, occupancy, equipment, or other operating expenses.
Why include a parts revenue multiplier?
Technicians do not just generate labor revenue. Their work often leads to parts sales as well. Including a parts multiplier gives a more complete picture of total revenue contribution.
Can this calculator be used for flat rate technicians only?
It works best for flat rate or billed-hour environments, but it can also be adapted for hourly technicians if you estimate their billed production accurately.
How can I improve technician revenue generation?
The biggest drivers are billed hours, labor rate, work mix, and shop efficiency. Better recruiting, stronger dispatching, improved advisor performance, and cleaner parts flow can all increase technician contribution.
Wrapping It Up
The Technician Revenue Calculator helps put a clear financial framework around technician performance. Instead of looking only at pay, it shows how billed hours, labor rate, and parts sales combine to create real annual value for the service department.
For many shops, this is a useful reminder that technicians are not simply a labor expense. Productive technicians are revenue-producing assets who drive labor sales, support parts gross, and help absorb fixed overhead.
Whether you are evaluating compensation, building a recruiting case, or trying to understand what one more technician could mean for your operation, this calculator gives you a practical starting point. In a competitive hiring market, knowing the true value of one technician can lead to much better decisions.
CarGuys Inc. is an dealership recruiting agency built exclusively for the car business. From technicians and service advisors to salespeople and managers, we connect dealerships and repair shops with qualified talent faster, using nationwide reach, and years of hands-on experience.


With over 700 clients and thousands of hires, we don’t just fill positions;
we help build stronger teams that drive long-term success.