Hiring too few technicians can quietly choke service revenue, increase customer wait times, and put extra pressure on your existing team. On the other hand, overstaffing can create unnecessary payroll strain if your shop does not have the workload to support it.
How the Technician Staffing Calculator Works
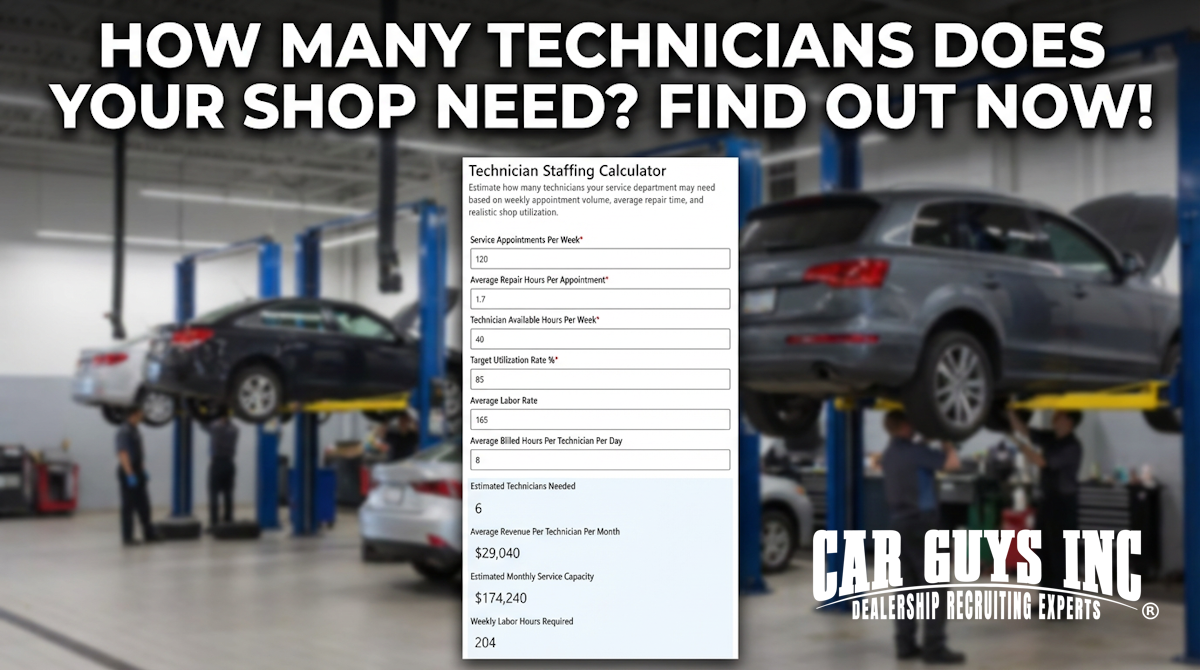
This Technician Staffing Calculator helps estimate how many technicians your service department may need based on appointment volume, average repair hours, technician availability, and your target shop utilization rate. It is designed for dealership service departments and independent repair shops that want a more practical way to align staffing with real workload.


This calculator gives you a directional estimate, not a one-size-fits-all answer. Real staffing needs can vary based on technician skill mix, express services, comeback rates, dispatch efficiency, advisor performance, and the type of work your shop sees most often.
Still, if your estimate shows that your current team is stretched too thin, that is often a sign that staffing shortages may be limiting both revenue and customer satisfaction. Even one missing technician can affect billed hours, repair order flow, and your ability to book work quickly.
Technician Staffing Benchmarks for Service Departments
To get more useful results, it helps to start with realistic benchmark ranges. Here are typical values many service departments use when evaluating staffing needs.
Service Appointments Per Week
This depends on shop size, service advisor effectiveness, and average job complexity.
Typical ranges:
- Small shop or low-volume department: 40 to 80
- Mid-size service department: 80 to 150
- High-volume dealership service lane: 150 to 300+
Not every appointment produces the same labor demand. Quick maintenance visits create a very different staffing requirement than diagnostics, drivability issues, or larger repair work.
Average Repair Hours Per Appointment
This is one of the most important inputs. It reflects how much technician time each appointment typically consumes.
Typical ranges:
- Quick service heavy mix: 1.0 to 1.8 hours
- Balanced general service mix: 1.8 to 3.0 hours
- Heavier repair and diagnostic mix: 3.0 to 5.0+ hours
A shop focused heavily on oil changes, tires, and light maintenance will be at the low end. A shop doing more diagnostics, engine work, suspension, or transmission jobs will usually be much higher.
Technician Available Hours Per Week
A full-time technician may be scheduled for 40 to 45 hours weekly, but actual available production time is often reduced by meetings, training, breaks, shop inefficiencies, and downtime.
Typical ranges:
- Conservative planning figure: 38 to 40 hours
- Standard full-time schedule: 40 to 45 hours
Many shops use 40 hours as a simple baseline for planning.
Target Utilization Rate %
Utilization rate measures how much of a technician’s available time is spent on actual billed work. No shop runs at 100 percent utilization for long without creating bottlenecks or burnout.
Typical ranges:
- Conservative and sustainable target: 75% to 85%
- Strong operational target: 85% to 92%
- Aggressive target: 92% to 95%
For planning purposes, many shops use 85% to 90% as a realistic range.
Average Labor Rate
Labor rates vary widely by region, brand, and business model, but this number helps connect staffing needs to revenue opportunity.
Typical ranges:
- Independent repair shops: $110 to $170 per hour
- Domestic and import dealerships: $150 to $220 per hour
- Luxury and specialty stores: $200 to $300+ per hour
This field helps management understand the financial impact of being understaffed.
Average Billed Hours Per Technician Per Day
This metric helps show what a productive technician can generate in a normal day, depending on dispatching, skill level, shop processes, and work availability.
Typical ranges:
- Average productivity: 6.0 to 7.5 billed hours
- Strong productivity: 7.5 to 9.0 billed hours
- High-performing environment: 9.0 to 12.0+ billed hours
Shops with weak dispatch systems or poor advisor-to-tech coordination often underperform here, even when customer demand is strong.
How to Estimate Technician Demand More Accurately
Why Technician Staffing Matters More Than Most Shops Realize
Many service departments assume technician shortages only affect the ability to complete repairs. In reality, the problem reaches much further.
When a shop does not have enough technicians to support incoming service demand, the ripple effects can include:
- Longer appointment lead times
- Slower vehicle turnaround
- Lower effective labor sales
- Reduced customer retention
- Increased advisor stress
- Lower technician morale
- Missed upsell opportunities
Even if the service drive looks busy, revenue can still be capped by limited technician capacity behind the scenes.
Technician Demand Should Be Based on Workload, Not Guesswork
Some shops hire reactively. They wait until bays are overloaded, customers complain, and current technicians are overwhelmed. By then, the business has already lost time, efficiency, and often revenue.
A better approach is to estimate staffing based on actual workload inputs:
- How many appointments come in each week
- How many repair hours those appointments usually create
- How many hours each technician can realistically produce
- What level of utilization your operation can sustain
That is exactly what this calculator is designed to help with.
The Difference Between Scheduled Hours and Productive Hours
One common staffing mistake is assuming every paid technician hour becomes a billed hour. That is rarely true.
Technicians may be clocked in for 40 hours, but those hours can be reduced by:
- Waiting on parts
- Delayed approvals
- Uneven dispatching
- Training time
- Shop meetings
- Warranty mix
- Lack of available work
- Inefficient workflow
That is why utilization rate matters. A shop with poor utilization often believes it needs more technicians, when the real issue may be process inefficiency. At the same time, shops with healthy utilization and strong incoming demand may clearly need more staff.
How Understaffing Hurts Revenue
Every technician represents billable capacity. If demand exists but there are not enough technicians to perform the work, the shop may be leaving significant revenue on the table.
For example, if one additional technician could consistently produce 8 billed hours per day at a $175 labor rate over 22 working days per month, that is:
8 x 175 x 22 = $30,800 in monthly labor sales potential
That number does not include parts revenue, additional inspections, maintenance recommendations, or improved customer retention.
This is why technician hiring is not just an HR issue. It is an operational and financial issue.

Why Shops Struggle to Staff Properly
Technician recruiting has become more competitive across the country. Dealerships and repair facilities are fighting for the same experienced candidates, especially those with strong diagnostic ability, brand certifications, or leadership potential.
Common reasons shops stay understaffed include:
- Waiting too long to start recruiting
- Weak employer branding
- Slow hiring processes
- Uncompetitive pay structures
- Limited recruiting reach
- Relying only on job boards
- Poor follow-up with applicants
The longer a role stays open, the more the service department may feel the impact.
Using This Calculator as a Planning Tool
This calculator works best when used regularly, not just once. Service demand changes with seasonality, advisor staffing, local competition, and manufacturer campaigns.
Good times to revisit your staffing estimate include:
- When appointment volume rises
- When opening more shop capacity
- When adding service advisors
- When losing a technician
- When lead times begin increasing
- When customer pay work starts backing up
- When trying to forecast revenue opportunities
Used this way, the calculator becomes a management tool, not just a website feature.
FAQ About Technician Staffing in Auto Repair Shops
What does a technician staffing calculator measure?
It estimates how many technicians your service department may need based on workload, available labor hours, and your target utilization rate.
Is this calculator only for car dealerships?
No. It can also be used by independent repair shops, fleet service operations, and other automotive service businesses.
What is a good utilization rate for a service department?
Many shops target around 85% to 90% for planning. Lower than that may indicate inefficiency or weak car count. Higher than that may signal a department running too tight.
Why include the average labor rate in the calculator?
Labor rate helps quantify the revenue value of technician capacity. It gives managers a clearer picture of the financial impact of understaffing.
What is the difference between available hours and billed hours?
Available hours are the hours a technician is scheduled and potentially able to work. Billed hours are the labor hours actually sold and charged on repair orders.
How often should I review technician staffing needs?
Monthly or quarterly is a good start. You should also review it anytime appointment volume, service demand, or technician headcount changes.
Can this calculator tell me exactly how many technicians to hire?
No. It provides a planning estimate. Final decisions should also consider technician skill level, work mix, dispatch quality, and business goals.
Final Thoughts on Service Department Staffing
A busy service drive does not always mean a properly staffed shop. Without enough technicians, your department may struggle to keep up with demand, protect turnaround time, and maximize labor revenue.
This Technician Staffing Calculator gives service managers, fixed ops leaders, and shop owners a more informed way to evaluate staffing needs using real operating inputs. When used alongside strong recruiting and better shop process management, it can help you build a more productive, more profitable service department.
CarGuys Inc. is an automotive recruiting company built exclusively for the car business. From technicians and service advisors to salespeople and managers, we connect dealerships and repair shops with qualified talent faster, using nationwide reach, and years of hands-on experience.

With over 700 clients and thousands of hires, we don’t just fill positions;
we help build stronger teams that drive long-term success.